Technical Indicators: Volume Weighted Average Price
The Volume Weighted Average Price (VWAP) is an indicator that is used to provide the average price at which the market has traded throughout the day, using both price (close, high and low) and volume.
It can help give a view on the value of the market as well as its trend.
The indicator calculates its values throughout the day so really only works with hourly or lower resolution. We suggest that you combine it with the EPF.Yahoo.HistoricIntraday formula.
The Excel formula for calculating VWAP is:
=EPF.TA.VWAP(closePrices, highPrices, lowPrices, volumes, datesTimes)
The input parameters required are:
| Parameter | Description |
|---|---|
| Close Prices | An Excel range of the prices. |
| High Prices | An Excel range of the high prices. |
| Low Prices | An Excel range of the low prices. |
| Volumes | An Excel range of the volume. |
| Dates/Times | An Excel range of the dates/times. |
The range of prices, volumes and dates must correspond and be of the same length, for example the first date in the date range must correspond to the first price in the price range.
The output columns are:
| Output Column | Description |
|---|---|
| VWAP | The volume weighted average price. |
| Date/Time | The date/time that the VWAP corresponds to. |
Example
"Calculate the VWAP for AAPL stock using intraday 1 minute data"
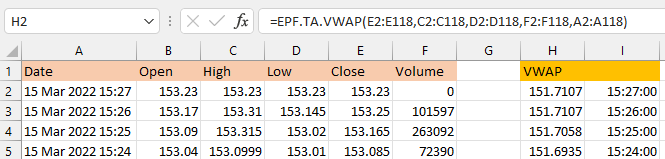
In this example you can see the 1-minute intraday AAPL price/date data in columns A to F (using the EPF.Yahoo.HistoricIntraday formula). The VWAP formula is in cell H2 and references the price/volume data:
=EPF.TA.VWAP(E2:E118,C2:C118,D2:D118,F2:F118,A2:A118)
The VWAP data can then be displayed in an Excel chart like below:
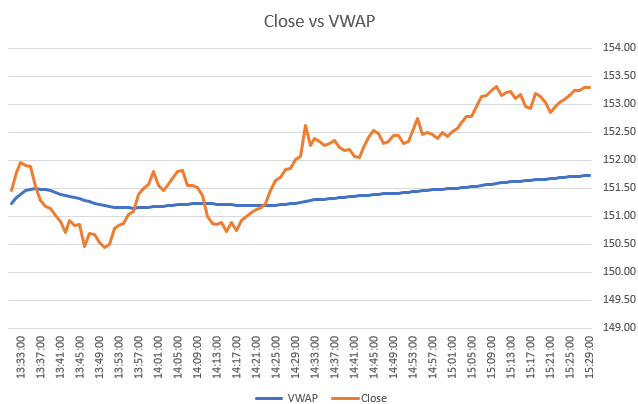
Because all of the data is generated via formulas (prices and VWAP), each time you refresh the spreadsheet the latest prices (minute data) are pulled into the sheet, the VWAP is re-calculated and the chart is updated automatically.