Technical Indicators / Technical Analysis in Excel
Excel Price Feed provides several technical indicators which you use to perform technical analysis on financial market data.
Unlike other Excel Add-ins, Excel Price Feed provides standard Excel formulas for technical analysis. This means that when your price data changes the technical indicator formula is automatically recalculated. You can easily combine these formulas with the Add-in's historical array formulas to build powerful financial models in your Excel spreadsheet.
=EPF.TA (ExcelPriceFeed.TechnicalAnalysis)
For example, the formula to calculate the simple moving average is:
=EPF.TA.SMA(prices, dates, lookbackWindow)
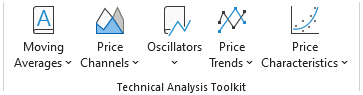
All of the technical analysis Excel formulas are also easily available via the ExcelPriceFeed tab in Excel:
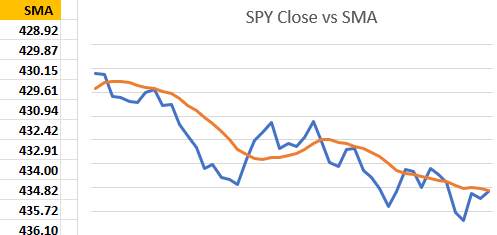
Once your spreadsheet is setup with a technical indicator formula you can easily plot the results on an Excel chart like below. This shows the close price of the S&P500 with the Simple Moving Average (SMA):
Excel Price Feed provides formulas for several technical indicators and we will adding more with each release.
Click on a link below to learn more about the indicator and how to use it in your spreadsheet: