Technical Indicators: Exponential Moving Average
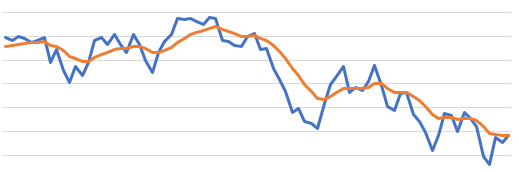
The Exponential Moving Average (EMA) is very similar to Simple Moving Average (SMA) as it also indicates trend direction over time.
The difference is that the EMA applies more importance (weight) to more recent data points, this results in an inidicator that follows prices more closely.
The Excel formula for calculating the Exponential Moving Average is:
=EPF.TA.EMA(prices, dates, lookbackWindow)
The input parameters required are:
| Parameter | Description |
|---|---|
| Prices | An Excel range of the prices. |
| Dates | An Excel range of the dates. |
| Lookback Window | The number of periods in the lookback window. |
The range of prices and dates must correspond and be of the same length, for example the first date in the date range must correspond to the first price in the price range.
The output columns are:
| Output Column | Description |
|---|---|
| SMA | The exponential moving average. |
| Date | The date that the simple moving average corresponds to. |