Example Excel Spreadsheets
The Add-in provides a huge range of new Excel formulas. Discovering which ones are available and how to use them can be a bit daunting.
Therefore, we have built and provide easy access to a bunch of example spreadsheets to help you quickly get started.
They are organised by data source:
- Yahoo Finance
- Interactive Brokers
- Federal Reserve Economic Data (FRED)
- EODHistoricalData.com
- Miscellaneous
To download a spreadsheet either click on its name or image; and do let us know if you have built a useful spreadsheet which you would like to share with others.
Yahoo Finance
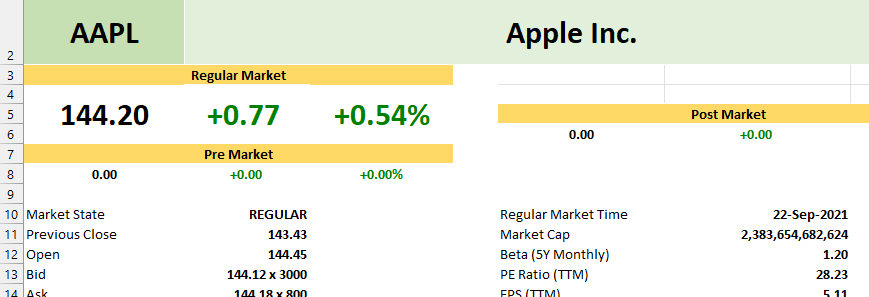
All Yahoo Finance Excel Formulas
This spreadsheet is a great introduction to the Add-in. It includes almost all the Excel formulas available for Yahoo Finance data.
It is structured similar to the Yahoo Finance website so should look familiar:
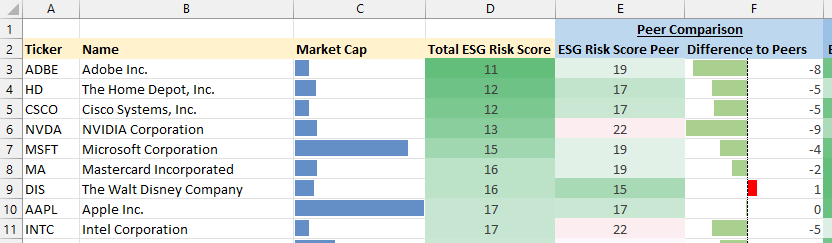
ESG Ratings Stock Analysis
This spreadsheet demonstrates how to compare Environment, Social and Governance (ESG) Risk Ratings across various companies, in this case the 30 DJIA constituents.
It also makes great use of some Excel visualization features such as data bars and heatmaps:
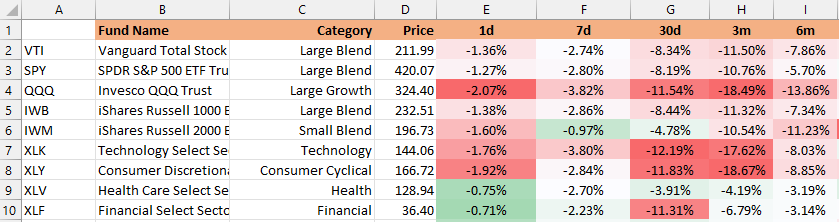
ETF Performance Heatmap
This spreadsheet shows how you can compare the historical performance of a set of sector specific ETFs.
It is structured as a heatmap so you can quickly see which sectors have performed the best. Please follow the instruction on the spreadsheet in order to refresh the data:
Interactive Brokers
Interactive Brokers Market Data Excel Formulas
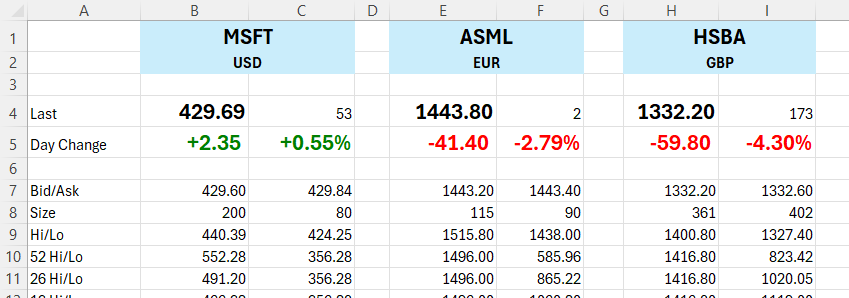
This spreadsheet demonstrates many of the market data fields available for a stock using the Interactive Brokers market data formulas.
To use it, simply change the values in the blue cells: the symbol and currency. Don't forget to connect to Interactive Brokers to start streaming.
Federal Reserve Economic Data (FRED)
FRED Data Explorer
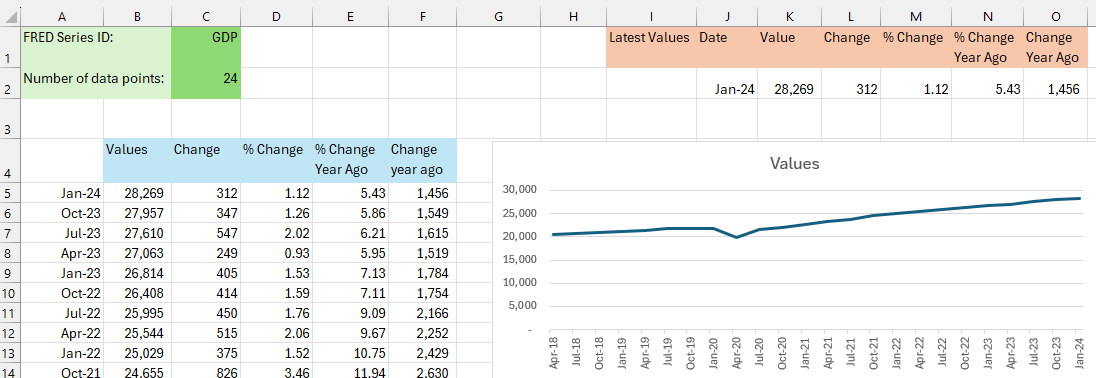
This spreadsheet demonstrates all the Excel formulas available for accessing FRED data.
There are two groups of formulas: historical time series formulas and single data point formulas.
FRED US Treasury Yield Analysis
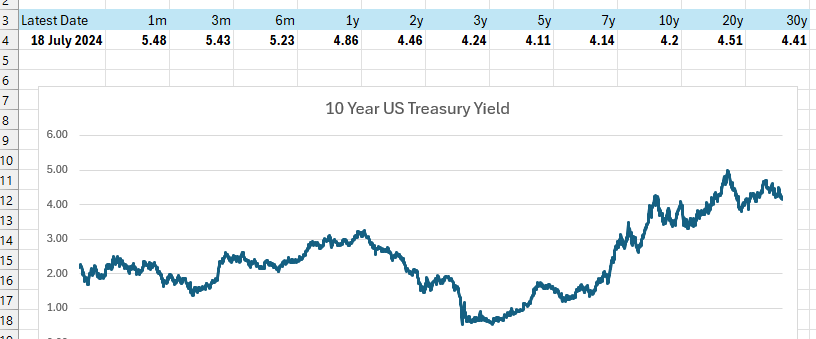
This spreadsheet shows how you can access US Treasury data, via FRED, to populate a spreadsheet with both current and historical US Treasury Bond yields.
The spreadsheet includes two charts: one showing historical data for the 10 Year US Treasury Note, and another plotting the spread between the 10 Year and 2 Year bonds:
EODHistoricalData.com
All EODHistoricalData.com Formulas
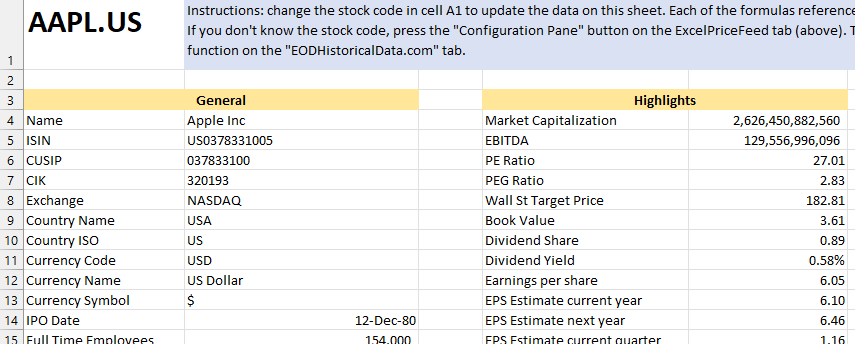
This spreadsheet demonstrates all the Excel formulas available for EODHistoricalData.com data.
It includes sections for fundamental data, financial report figures for income statement/balance sheet/cash flow (annual and quarterly), historical shares outstanding (annual and quarterly) as well as historical daily close prices.
Miscellaneous
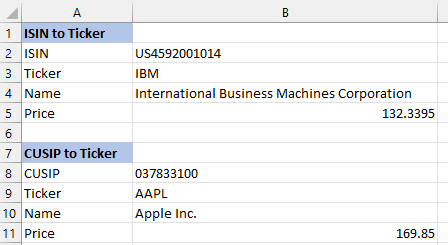
Instrument Identifier Conversion Formulas
This spreadsheet shows how you can use the instrument identifier conversion formulas.
These formulas allow you to easily convert between industry standard financial instrument codes such as an ISIN or CUSIP to more commonly used tickers:
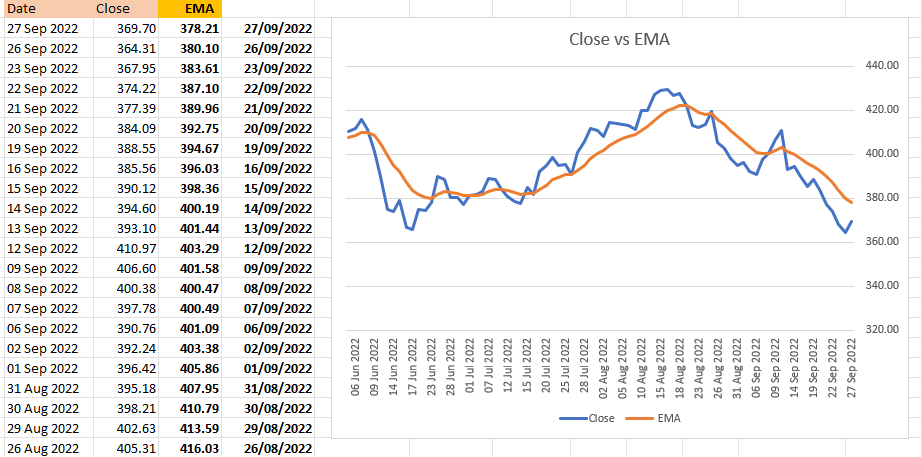
Technical Analysis Toolkit Formulas
This spreadsheet shows how you can use the Technical Analysis Toolkit formulas.
These formulas enable you to perform technical analysis on historical financial market data: