EODHistoricalData.com Historical Price Data
Multiple historical prices in Excel without a formula
You can download historical data without using a formula at all, which is great for a one-off or ad-hoc download of historical prices.
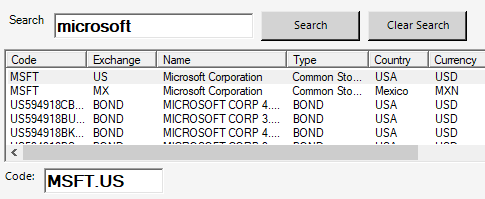
To get started, launch the Configuration Pane and search for the instrument in the Search box on the EODHistoricalData.com tab. Select the instrument, for example here Microsoft Stock (MSFT.US) is selected:
On the tab below, select the data you wish to download:
- Resolution: Select a resolution for the data you require: daily, weekly or monthly.
- Range: You need to specify a date range.
- Sort Order: either Descending (latest first) or Ascending.
- Include Column Headers: Whether to include column headers or not.
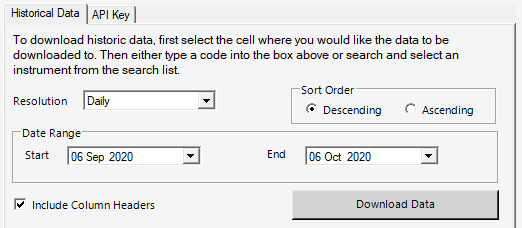
Ensure the cell where you would like the data to be downloaded to is selected in your spreadsheet.
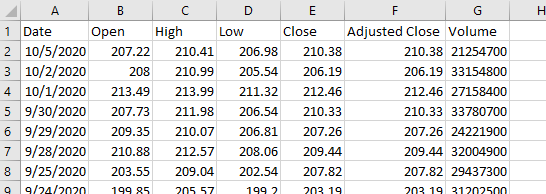
Press the "Download Data" button and the requested historical data will be downloaded from EODHistoricalData.com into your spreadsheet:
Multiple historical prices in Excel using a formula
The Add-in provides an Excel Array Formula which can be used to download historical price data directly into a spreadsheet.
EPF.EOD.HistoricDatePeriod
This formula populates your spreadsheet with historical price data for the specified date period:
=EPF.EOD.HistoricDatePeriod(Symbol.Exchange, Resolution, Start Date, End Date, Order, Include Headers)
The input parameters required are:
| Parameter | Description |
|---|---|
| Symbol.Exchange | The symbol/exchange, for example "AAPL.US" or "MSFT.US". |
| Resolution | The resolution of the data: ("daily" or "d") or ("weekly" or "w") or ("monthly" or "m"). |
| Start Date | The start date of the historical price data. |
| End Date | The end date of the historical price data. |
| Order | The order that the data will be displayed, either "DESC" for Descending (latest prices first) or "ASC" for Ascending (oldest prices first). |
| Include Headers | Whether to display column headers for the data, either 1 to show or 0 to hide. |
The output columns are:
| Output Column | Description |
|---|---|
| Date | The historical price date. |
| Open | The open price of the period. |
| High | The high price of the period. |
| Low | The low price of the period. |
| Close | The close price of the period. |
| Volume | The volume of stock traded during the period. |
Example
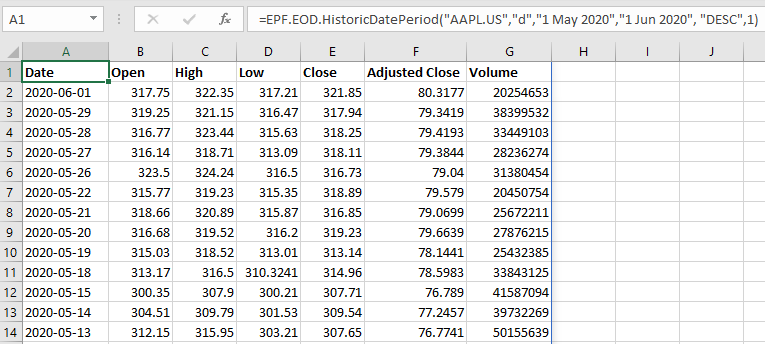
We would like to populate our spreadsheet with daily historical data for Apple stock for May 2020. We insert the following formula into cell A1:
=EPF.EOD.HistoricDatePeriod("AAPL.US", "d", "1 May 2020", "1 Jun 2020", "DESC", 1)
Where "AAPL.US" is for Apple Stock; "d" is for the resolution; "1 May 2020" is the start date; "1 Jun 2020" is the end date; "DESC" as we want the data in descending date order; "1" as we want to display column headers
This will output the following to Excel: