Technical Indicators: Heikin Ashi
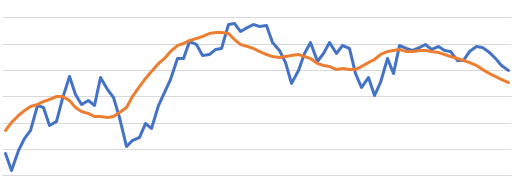
Heiken Ashi (meaning "average bar" in Japanese) is a type of charting technique or indicator used in technical analysis to smooth out price action and identify trends more clearly.
Historical Price Requirements
Excel Formula Details
=EPF.TA.SMA(prices, dates, lookbackWindow)
The input parameters required are:
| Parameter | Description |
|---|---|
| Prices | An Excel range of the prices. |
| Dates | An Excel range of the dates. |
| Lookback Window | The number of periods in the lookback window. |
The range of prices and dates must correspond and be of the same length, for example the first date in the date range must correspond to the first price in the price range.
The output columns are:
| Output Column | Description |
|---|---|
| Date | The date that the simple moving average corresponds to. |
| SMA | The simple moving average. |
Example Excel Formula
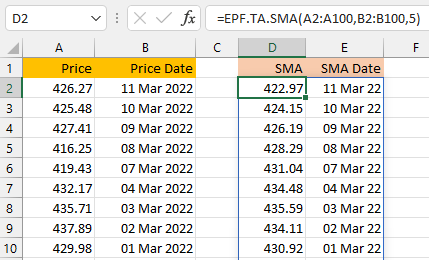
"Calculate the SMA with a 5 day lookback window"
In this example you can see the price/date data in columns A and B respectively. The SMA formula is in cell D2 and references the price (A2:A100) and date (B2:B100) ranges as well as the 5 period lookback:
=EPF.TA.SMA(A2:A100,B2:B100,5)
The formula calculates the SMA and returns the SMA and corresponding dates to columns D and E respectively: