ETF Performance Heatmap
Ready to use spreadsheet: Click the button below to download the ETF Performance Heatmap example spreadsheet and save it to your PC, then open it in Excel.
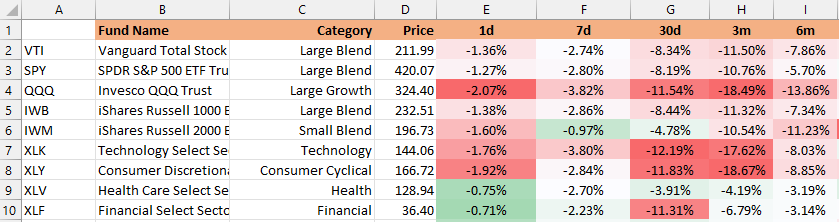
This spreadsheet shows how you can use the Yahoo Finance ETF formulas to compare the historical performance of a set of sector specific ETFs.
It is structured as a heatmap so you can quickly see which sectors have performed the best. Please follow the instruction on the spreadsheet in order to refresh the data.