Getting Started
- Introduction
- Download
- Installation & Activation
- Troubleshooting
- Data Refresh/Updates
- Software Updates
- Manage Your Subscription
- Example Spreadsheets
General Formulas
Technical Analysis Toolkit
- Introduction
- Simple Moving Average (SMA)
- Exponential Moving Average (EMA)
- Volume Weighted Average Price (VWAP)
- Average True Range (ATR)
- Bollinger Bands
- Aroon
Yahoo Finance
IG Index / IG Markets
- Account Setup
- Formula Reference
- VBA Functions Reference
- Historical Price Data Download To Excel
- Historical Price Data Download To File
- Historical Client Sentiment Data Download
- Watchlists
- Live Positions, Transactions & Activity History
EODHistoricalData.com
Nasdaq Data Link
Technical Indicators: Bollinger Bands
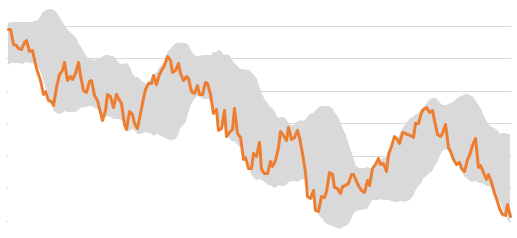
Bollinger Bands are price channels based on a moving average and standard deviation.
[Bollinger Bands ® is a registered trademark of John A. Bollinger.]
The standard deviation bands widen or narrow according to market volatility. You can use these bands to identify both support and resistance, as well as identify price breakouts. If the price moves outside the upper or lower bands, it can be seen as a indication of a continued move in that direction.
If the bands narrow, then this indicates shrinking volatility and can be interpreted as a precursor to a sharp breakout and increased volatility.
The Excel formula for calculating Bollinger Bands is:
=EPF.TA.BollingerBands(inputPrices, inputDates, lookbackPeriods, standardDeviations)
The input parameters required are:
| Parameter | Description |
|---|---|
| Input Prices | An Excel range of the input prices, generally bar close prices. |
| Input Dates | An Excel range of the input dates. |
| Lookback Periods | The number of periods in the lookback window. |
| Standard Deviations | Width of the bands, Standard deviations (D) from the moving average. Must be greater than 0. |
The range of prices and dates must correspond and be of the same length, for example the first date in the date range must correspond to the first price in the price range.
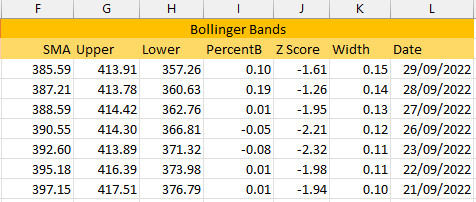
The output columns are:
| Output Column | Description |
|---|---|
| SMA | The Simple Moving Average (SMA) of price. |
| Upper Band | The Upper Line is D standard deviations above the SMA. |
| Lower Band | The Lower Line is D standard deviations above the SMA. |
| PercentB | B is the location within the bands. (Price-LowerBand)/(UpperBand-LowerBand). |
| ZScore | Z-Score of current price (number of standard deviations from mean). |
| Width | Width as percent of SMA price. (UpperBand-LowerBand)/Sma. |
| Date | The date that the band corresponds to. |
Here is an example of how the output from the Bollinger Bands Excel formula looks in your spreadsheet:
We have also published an article on our blog with more details on how to use the technical indicator Excel formulas in your spreadsheet with particualr emphasis on Bollinger Bands.