Getting Started
- Introduction
- Download
- Installation & Activation
- Troubleshooting
- Data Refresh/Updates
- Software Updates
- Manage Your Subscription
- Example Spreadsheets
General Formulas
Technical Analysis Toolkit
- Introduction
- Simple Moving Average (SMA)
- Exponential Moving Average (EMA)
- Volume Weighted Average Price (VWAP)
- Average True Range (ATR)
- Bollinger Bands
- Aroon
Yahoo Finance
IG Index / IG Markets
- Account Setup
- Formula Reference
- VBA Functions Reference
- Historical Price Data Download To Excel
- Historical Price Data Download To File
- Historical Client Sentiment Data Download
- Watchlists
- Live Positions, Transactions & Activity History
EODHistoricalData.com
Nasdaq Data Link
Technical Indicators: Aroon
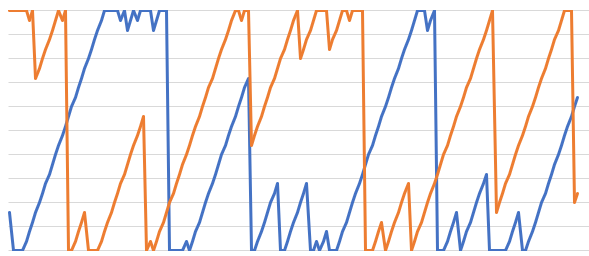
The Aroon indicator is an oscillator view of how long ago the new high or low price occurred. It can help indicate if a price is in a trading range or trending.
AroonUp shows how long it has been since a new high was achieved within the specified period.
AroonDown shows how long it has been since a new low was achieved within the specified period.
The Excel formula for calculating Aroon is:
=EPF.TA.Aroon(closePrices, highPrices, lowPrices, datesTimes, lookbackPeriods)
The input parameters required are:
| Parameter | Description |
|---|---|
| Close Prices | An Excel range of the close prices. |
| High Prices | An Excel range of the high prices. |
| Low Prices | An Excel range of the low prices. |
| Lookback Periods | The number of periods in the lookback window. |
The range of prices and dates must correspond and be of the same length, for example the first date in the date range must correspond to the first price in the price range.
The output columns are:
| Output Column | Description |
|---|---|
| AroonUp | Based on the last High price. |
| AroonDown | Based on the last Low price. |
| Oscillator | AroonUp - AroonDown. |
| Date | The date that the average true range corresponds to. |